CommerceLens
E-commerce Analytics & Customer Intelligence
An end-to-end analytics project designed to explore e-commerce performance, customer behaviour and retention through a structured Python application.
- Type
- Data Analytics / Software Engineering
- Role
- Individual project
Overview
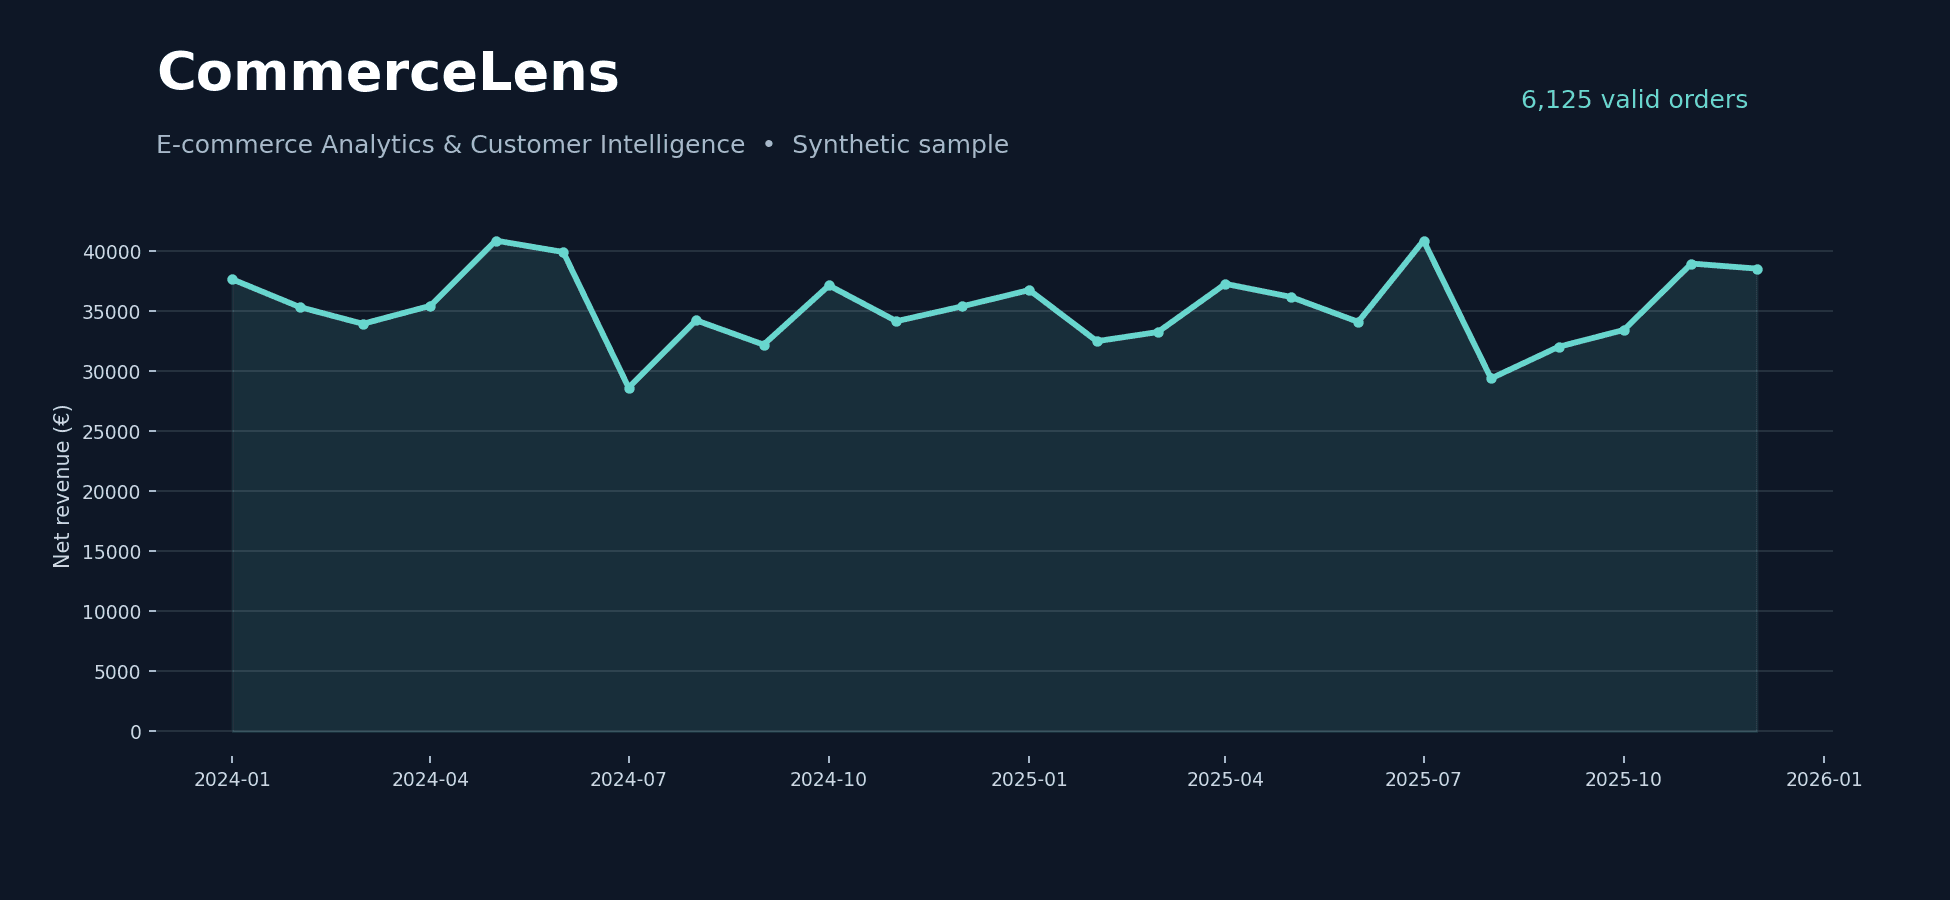
CommerceLens is an end-to-end analytics project that explores e-commerce performance, customer behaviour and retention through a structured Python application. It turns order-level transactions into revenue KPIs, RFM customer segments and monthly cohort retention, and presents them in an interactive Streamlit dashboard.
It is an individual portfolio project about analytics methodology and code structure. It runs on synthetic data and is not a trained predictive model.
Problem
An online retailer needs practical answers to four questions:
- How are revenue, average order value and returns changing over time?
- Which product categories and markets drive revenue?
- Which customers are high-value, loyal, at risk or dormant?
- How often do first-time buyers return in later months?
Data & methodology
The dataset is entirely synthetic: 6,500 orders generated reproducibly with a fixed random seed, spanning January 2024 to December 2025, five product categories and four markets. No real customer or sales data is used.
Every order is validated before any calculation: required columns, unique order IDs, positive integer quantities, non-negative prices, discounts between 0 and 1, and a boolean returned flag. Metrics are then defined explicitly:
- Net revenue: quantity × unit price × (1 − discount); returned orders contribute zero.
- Average order value: net revenue divided by the number of non-returned orders.
- Return rate: returned orders divided by total orders.
Application architecture
The code is split by responsibility inside a small installable Python package, with dependencies and packaging declared in pyproject.toml.
- analysis.py: validation, KPIs, monthly revenue, RFM segmentation and cohort retention.
- generate.py: deterministic synthetic data generator.
- report.py: command-line summary and exported analytical tables.
- app.py: Streamlit dashboard with market, category and date filters, using Plotly charts.
- tests/: unit tests for the business logic.
Customer analytics
RFM segmentation scores each customer on recency (days since the last non-returned order), frequency (number of non-returned orders) and monetary value (cumulative net revenue). Scores are rank-based from 1 to 5, which avoids duplicate bin edges when many customers share the same frequency, and map to descriptive groups: Champions, Loyal, At risk, Hibernating and Potential.
Cohort retention groups customers by the calendar month of their first non-returned purchase and measures the share who buy again in each following month. Month zero is always 100%.
In the dashboard, segments and cohorts are recomputed on the filtered data, so filtered views need to be read with care.
Testing & code quality
Unit tests cover the treatment of returns, discounts, deduplication, RFM frequency and cohort retention, as well as the validation errors raised for duplicate orders and invalid discounts.
A GitHub Actions workflow installs the package, regenerates the dataset, runs the report and executes the test suite on every push and pull request. Because the data is generated with a fixed seed, the analysis can be reproduced from a clean checkout.
Results
The result is a working analytics application: a validated order pipeline, revenue and business KPIs, RFM segments, monthly cohort retention and an interactive Streamlit dashboard, backed by automated tests and continuous integration. From the command line, the project also exports three analytical tables: monthly revenue, customer segments and cohort retention.
What I learned
Skills learned by building
Limitations
Possible extensions: a real, licensed public e-commerce dataset with documented cleaning, SQL transformations, and an out-of-time repeat-purchase prediction task evaluated against a baseline.
- The data is synthetic: results demonstrate a methodology, not real business outcomes, and the project is not a predictive ML model.
- Returns are simplified: a returned order contributes zero net revenue instead of being recorded in a refund ledger.
- RFM segment labels are descriptive heuristics.
- Later cohorts have shorter observation windows, so incomplete cohorts should not be compared uncritically.
- Costs, profit, causal inference, lifetime value and forecasting are out of scope.